12. Separation by Ligand Exchange Ability Differences
12-1. What is a ligand?
Ligand is a general term for a complex consisted of molecules and ions that bond to a central metal ion. Ligand exchange ability in HPLC refers to a strength of a complex (complex formation ability) formed between counter ions (metal ions) of the functional group and hydroxyl groups of sugars.
12-2. Ligand exchange mode (ligand exchange chromatography) and its mechanism
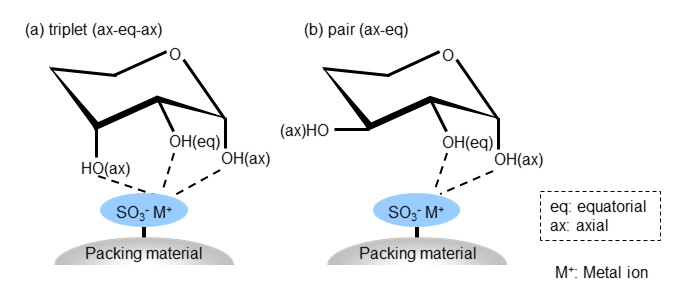
Ligand exchange mode takes an advantage of differences in ligand exchange ability. It is mainly used for sugar analysis for the following reason. Sugars are aldehydes (aldoses) or ketones (ketoses) with many hydroxyl groups and are known to have a cyclic structure with an energetically stable chair conformation. The hydroxyl groups bonded to each carbon is placed horizontally (equatorial position) or vertically (axial position) depending on the bond position. This steric configuration of the hydroxyl group also differs depending on the type of sugar. The packing material used in ligand exchange mode has a sulfo group bonded as a functional group, and a metal ion is bonded to this sulfo group as a counter ion. Metal ions form complexes with the hydroxyl groups of sugars, and the strength of the complex varies depending on the steric configuration of the hydroxyl groups. Figure 25 shows the separation mechanism of ligand exchange mode. In the conformation (a), the three hydroxyl groups form a complex (triplet) with the metal ion. In conformation (b), two hydroxyl groups form a complex (pair). This will be a weaker complex than (a). In ligand exchange mode, sugars with lower complex-forming ability elute faster.
In actual sugar analysis, separation is performed not only using the ligand exchange mode, but also in combination with size exclusion mode (described later) and the HILIC mode (described earlier). Therefore, even if there is no difference in complex formation ability, separation may be possible if there is molecular size or polarity differences, and similarly even if separation is not possible using a simple size exclusion mode or HILIC mode, separation may be achieved by combining ligand exchange mode. Figure 26 shows the elution order of sugars using a combination of ligand exchange mode and size exclusion mode. Under the effects of size exclusion, sugars are eluted in order of larger to smaller molecular weights. It is interesting to note that glucose (peak number 5) and galactose (peak number 6) are monosaccharides and are stereoisomers. Since both have the same molecular weight, they cannot be separated using size exclusion mode alone, but here, they are separated by the influence of ligand exchange mode. Ligand exchange mode is suitable for separating monosaccharides and disaccharides isomers by taking an advantage of this difference in complex formation ability.
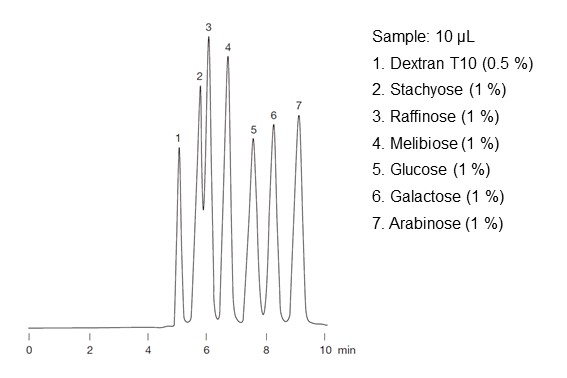
- Column
- :Shodex SUGAR SC1011 (8.0 mm I.D. x 300 mm)
- Eluent
- :H2O
- Flow rate
- :1.0 mL/min
- Detector
- :RI
- Column tamp.
- :80 ℃
There are various metal ions used in ligand exchange mode, where each metal ion has different complex-forming ability strength. The complex-forming ability strength of counter ions is roughly in the order of Ag+ < Li+ < Na+ < Zn2+ < Ca2+ < Ba2+ < Pb2+.
Shodex offers ligand exchange columns having counterions of calcium (Ca2+), lead (Pb2+), zinc (Zn2+), and sodium (Na+). The combination of sugars that can be separated differs depending on the column. Please check the website summarizing the Elution Volume of Saccharides.
Find Shodex Ligand Exchange Chromatography Columns (Ligand Exchange and Size Exclusion) HERE
Find Shodex Ligand Exchange Chromatography Columns (Ligand Exchange and HILIC) HERE
13. Separation by Molecular Size (Molecular Weight) Differences
All separation modes introduced so far utilize the interaction between packing materials and analytes. The separation mechanism of size exclusion mode differs from those chemical interaction but uses difference in physical property (molecular size) to separate the analytes.
13-1. Naming of size exclusion mode (size exclusion chromatography)
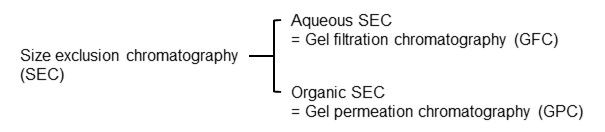
The first development of size exclusion chromatography (SEC) started in 1955 by G. H. Lathe and C. R. J. Ruthven from the UK. In 1959, J. Porath and P. Flodin from Sweden published a paper on protein separation and desalting using cross-linked dextran particles. In their paper, they called the technique “gel filtration chromatography (GFC)”. Then in 1964, an American scientist 1964, J. C. Moore published a method for measuring molecular weight distribution of synthetic polymers using polystyrene (PS) particles and named the technique “gel permeation chromatography (GPC)”. From around the time, the naming GFC and GPC are used depending on the eluent used. However in recent years, the academic terminology has been unified as SEC. Also, cases where an aqueous solution is used as an eluent are called aqueous SEC, while cases where an organic solvent is used are called organic SEC.
13-2. Size exclusion (SEC) mode and its separation mechanism
There are many pores on the packing material. SEC mode uses these pores to separate analytes. The separation mechanism in SEC mode can be explained as described in figure 28, assuming that a pore is a cone shape. The diameter of the pore becomes narrower as it goes deeper into the pore, so an analyte with a small molecular size (blue molecule in figure 28 (a)) can penetrate deep into the pore. But analytes with larger molecular sizes can only enter middle-way or so into the pores (purple and green molecules in figure 28 (a)) and as the molecular size increases even more, they cannot enter the pores at all, passing only through the surface of the packing material and eluting from the column faster (orange and pink molecules in figure 28 (a)). Analytes that can enter the pores pass through the column by repeated entering and exiting to/from the pores. Thus, the smaller the molecular size of the analyte, the deeper the analyte can enter the pores, and the longer the distance traveled within the column. Furthermore, since SEC mode is based on an assumption where there is no chemical interaction, the movement speed of each analyte should be constant. Therefore, in SEC mode, analytes elute in the order of larger to smaller molecular sizes, as shown in figure 28 (b).
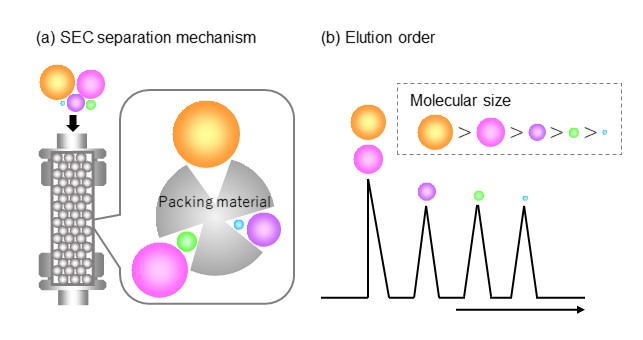
Figure 29 shows an example of standard protein separation, and figure 30 shows an example of polycarbonate separation using SEC mode.
For monodisperse (composed of a single molecular weight) analytes such as proteins, each analyte appears as a peak. On the other hand, compounds similar to synthetic polymers and polysaccharides are aggregates of molecules having different weights. When analyzed by SEC, they continuously elute from bigger to smaller sizes, and as a result it appears as one wide peak.
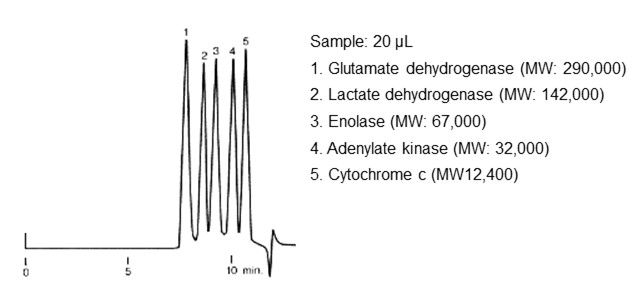
- Column
- :Shodex PROTEIN KW-803 (8.0 mm I.D. x 300 mm)
- Eluent
- :
50 mM Phosphate buffer (pH7.0) + 0.3 M NaCl - Flow rate
- :1.0 mL/min
- Detector
- :UV (280 nm)
- Column tamp.
- :Room temp.
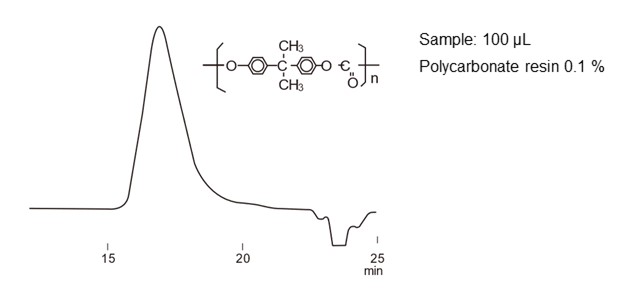
- Column
- :Shodex GPC KF-806L (8.0 mm I.D. x 300 mm) x 2
- Eluent
- :
THF - Flow rate
- :1.0 mL/min
- Detector
- :RI
- Column tamp.
- :40 ℃
13-3. Molecular weight determination
Determining the molecular weight and molecular weight distribution is important in understanding the physical properties of polymers. SEC mode is often used to measure the molecular weight and molecular weight distribution of polymers, and the analysis results provide information such as number average molecular weight (Mn), weight average molecular weight (Mw), and polydispersity (Mw/Mn).
In molecular weight distribution determination using SEC mode, calibration standard samples with known molecular weights are analyzed under the same analysis conditions as the analyte, and a calibration curve is created by plotting the relationship between the molecular weight of each standard sample and the retention time (retention capacity) at the top of the peak. This calibration curve is used to obtain the molecular weight from the elution position data. The important point here is that SEC mode is a separation mode that takes an advantage of differences in molecular size. Polymers with the same molecular weight but different molecular structures do not necessarily have the same molecular size. If molecular sizes of two analytes are different, their elution positions will be different even if their molecular weights are the same, so ideally, it is best to use calibration standard samples with the same structure as the polymer to be measured. But in reality, it is difficult to obtain calibration standard samples corresponding to each polymer. Therefore, calibration curves are prepared by selecting commercially available calibration standard samples with similar molecular structures and solubility. The molecular weight information obtained from the calibration curve is the molecular weight of the standard sample used, thus that is a "relative molecular weight."
Shodex offers pullulan calibration standards for aqueous SEC, and polystyrene (PS) and polymethyl methacrylate (PMMA) calibration standards for organic solvent SEC.
Find Shodex Calibration Standards for Aqueous SEC (GFC) HERE
Find Shodex Calibration Standards for Organic SEC (GPC) HERE
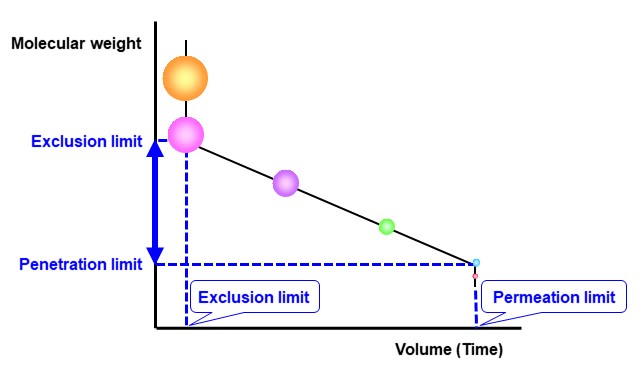
Figure 31 shows a model diagram of a calibration curve. As mentioned earlier, large molecules (orange and pink) that do not fit into the pores are eluted together even if their molecular weights (molecular sizes) are different. Polymers eluting at this position cannot be separated using differences in their molecular sizes.
This elution position is called the “exclusion limit volume” and the smallest molecular weight of the polymers that elute at this position is called the “exclusion limit”. On the other hand, all analytes smaller than a certain molecular size also penetrate deep into the pores and are eluted together at the end, making it impossible to separate them. This elution position is called the "permeation limit volume," and the largest molecular weight of the polymers that elute at this position is called the "permeation limit”. When measuring molecular weight distribution of polymers, it is important to select a column in which the polymer's constituent components do not exceed the exclusion limit capacity and permeation limit capacity.
Shodex offers SEC mode with various pore sizes. On our website and catalog, in addition to the exclusion limit, target molecular weight range of each SEC columns are listed. Please use them as a reference when selecting a column.
Find Shodex Aqueous SEC (GFC) Columns HERE
Find Shodex Organic SEC (GPC) Columns HERE
Shodex offers multi-mode columns that primarily works as SEC mode, but also work in combination with reversed phase, HILIC, and/or ion exchange mode. We also offer SEC columns that can be used in both aqueous and organic solvents.
Find Shodex Multimode and Aqueous/Organic SEC Columns HERE
14. Separation by Specificity Differences
There are separation modes that take advantages of sample specificity. Here, we briefly introduce chiral separation and affinity chromatography.
14-1. Chiral separation
Mirror image isomers (enantiomers) are stereoisomers that have symmetrical structures resembling each other when reflected in a mirror. They cannot be superimposed on each other, and it is often easier to understand by imagining them as right and left hands. One enantiomer of a mirror image pair exhibits a property of bending light to the right (dextrorotatory), while the other exhibits a property of bending light to the left (levorotatory). For this reason, mirror image isomers are also referred to as optical isomers. Optical isomers, even though they may have identical physical and chemical properties, can exhibit different effects (biological activity) when ingested by human bodies. For example, L-glutamic acid sodium is well-known as umami, a savory flavor enhancer, while its optical isomer D-glutamic acid sodium is almost tasteless and does not function as an umami. You can see that one enantiomer may exhibit useful biological activity while the other may not, or even have adverse effects on human bodies. Pharmaceutical raw materials often include optical isomers. When synthesizing optical isomers in a manufacturing process, it is difficult to selectively synthesize only the desired optical isomer, and often both optical isomers are synthesized simultaneously. Therefore, the separation of optical isomers becomes crucial. The separation of optical isomers using chromatography is referred to as chiral separation. There are several types of interactions involved in chiral separation. Shodex utilizes host-guest type columns for chiral separation using a cyclic oligosaccharide, β-cyclodextrin, derived ligand. The analytes are captured in the cavity of β-cyclodextrin, forming inclusion complexes, and the separation of enantiomers is achieved by the inclusion complexation differences of enantiomers.
Find a Shodex Chiral Separation column HERE
14-2. Affinity chromatography
The separation mechanism of affinity chromatography can be compared to the relationship between a key and a keyhole. The ligand bound to the stationary phase is considered a keyhole, and the analyte is seen as a key. As only the key that matches the keyhole can unlock a door, only specific analytes with a biochemical affinity to the ligand are retained while other components are not retained. To elute the analyte, change the eluent composition to dissociate the analyte from the ligand. Affinity chromatography is highly selective and an excellent analytical technique for isolating and purifying specific analytes. However, a drawback is that it requires setting specific ligands, retention conditions, and elution conditions for each analyte.