5. Principles of Separation
In “4-3. Separation unit”, we mentioned that sample components are separated as they pass through a column. But how exactly are the analytes separated within the column? Let's imagine that analytes are represented by "people" and the column is represented by a "shopping street" to understand the principle of separation. There are three people in this story. A loves shopping, B plans ahead and decides what to buy beforehand, and C is a budget-conscious person. They all entered the shopping street at the same time. A visited several stores, enjoying window shopping, and then left the shopping street. B only purchased the items she had planned in advance and left the shopping street. C on the other hand, didn't stop at any store and passed through the shopping street. Although all three entered the shopping street at the same time, they exited in the order of C, B, and A. This is because their tendency towards shopping were different (Figure 6)
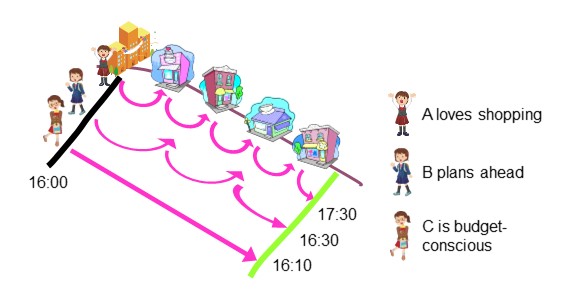
Let’s bring the story back to HPLC. The packing material used in HPLC columns contains various "tricks" and each component in the sample passes through the column while interacting with these "tricks". This interaction between the sample components and the packing material differs among the components. The difference in amount of time (residence time) passing through the column results in the separation of components.
In our shopping street story, is the order of three people walking out the street always the same? No, if a condition changes, the order may also change. For an example, if it starts raining and if B did not have an umbrella, she may run home passing by C who had an umbrella.
“Change in condition” in HPLC equals to “change in analytical condition”. The analytical conditions include eluent compositions, flow rate, column temperature etc. Even with the same packing material (column), if analytical conditions change, analytes response change and may results in different separation patterns. Especially, the eluent composition has a large impact on the analytes and packing material interactions. If changing analytical conditions does not improve the separation, it may be necessary to consider using a column with different "mechanisms". This is where HPLC analysis becomes challenging.
At Shodex, based on our extensive knowledge and experience accumulated over the years, we offer a vast amount of application data on Shodex website. You can search them by analysis categories, sample or product name, and keywords. Please make a use of this resource for your column selection and analysis condition considerations.
Check applications HERE
6. Chromatogram
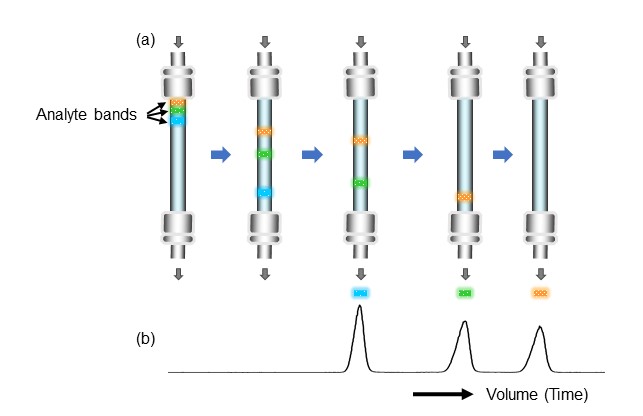
When sample components are introduced into a column together with an eluent, they diffuse into a band as shown in Figure 7(a). Each sample component then passes through the column while repeatedly interacting with the packing material. The components with weaker interactions move faster and elute from the column first.
The detector constantly outputs electrical signals, and the data processing device records the received electrical signals as changes in signal strength over time. This is the chromatogram. As shown in Figure 7(b), when sample components are detected by the detector, the signal intensity increases, and a mountain-shaped wave (peak) appears on the chromatogram.
The ideal peak shape is a symmetrical Gaussian curve. However, sometimes peaks can also appear with fronting (leading), where the first half of the peak rises more gently than the second half, or tailing, where the second half of the peak show dragging. Additionally, if the analyte spreads widely within the column (=broad band width), the overall peak width will become wider (Figure 8).
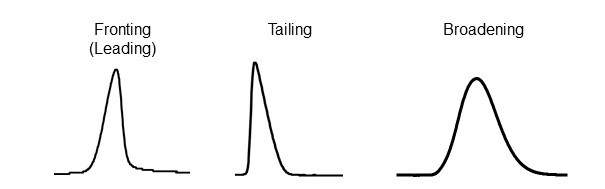
Leading or tailing may influence separation of closely eluting analytes or impurities. They may also lower peak heights which can reduce sensitivity. A column with good column efficiency (performance) is the one that has low analyte diffusion within the column and produces a sharp, symmetrical peak shape. In reality, there are other factors that have a large impact on peak shapes, such as HPLC system itself, analysis conditions, or sample loading amount. Thus, it is also important to create an environment that allows the column to perform at its full potential.
7. Basic HPLC Terminology
Basic terminology related to HPLC are explained in three parts: chromatogram, column performance parameters, and peak separation parameters.
7-1. Chromatogram terms
A chromatogram provides various information not limited to peak positions and their sizes. Figure 9 shows the terms used in a chromatogram.
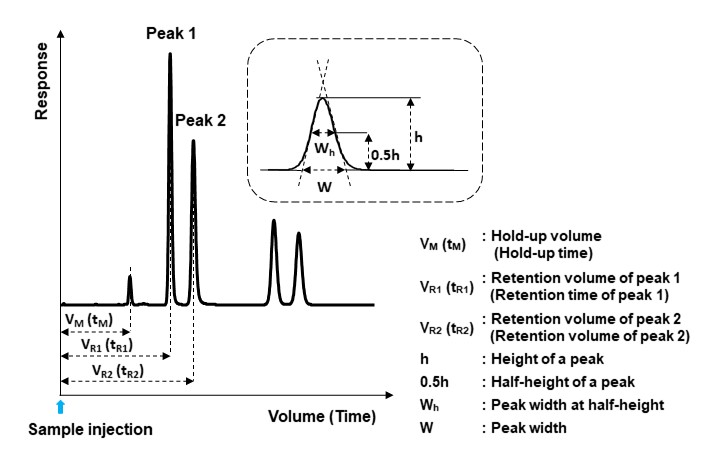
Hold-up volume (VM) and Hold-up time (tM)
Hold-up volume or time is the volume or time of an unretained component to be eluted (measured at the peak top of the component). They are also called “void volume or time” or “dead volume or time”. However, nowadays the use of the term hold-up volume or time is recommended over void/dead volume or time.
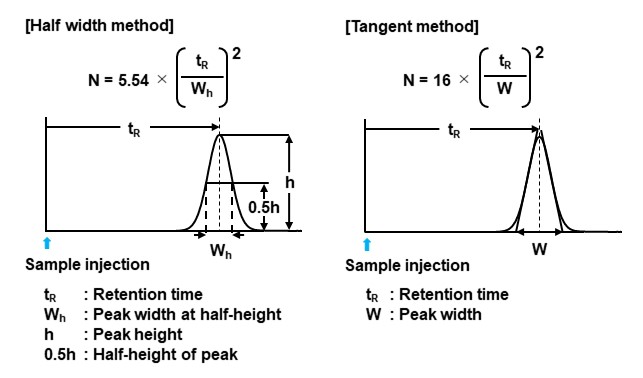
Peak width (W) and Half peak width (Wh)
Peak width is the width connected at the intersection of the tangents at the inflection points on both sides of a peak and the straight line (baseline), connecting both ends of the peak. Half peak width refers to the width of a peak at the midpoint of the peak height.
7-2. Column performance parameters
This section includes theoretical plates and two coefficients which describe peak symmetry: asymmetry and symmetry coefficients.
Theoretical plates (N)
The number of theoretical plates is an index for peak sharpness. The larger the number, the better the column efficiency. There are multiple methods to calculate the number of theoretical plates. Figure 10 shows two typical calculation methods: the half-width method and the tangent method. The "half-width method" is adopted by the Japanese Pharmacopoeia (JP) and the United States Pharmacopeia (USP). Shodex also uses the "half-width method." Please note that the number of theoretical plates changes depending on the sample and analysis conditions used.
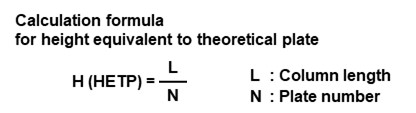
Height equivalent to a theoretical plate (HETP)
The height equivalent to a theoretical plate is the column length equivalent to one theoretical plate expressed in mm. The smaller the value, the better the column efficiency. The number of theoretical plates is proportional to the column length, but the HETP does not depend on the column length, so the HETP is used as an indicator of a packing material efficiency.
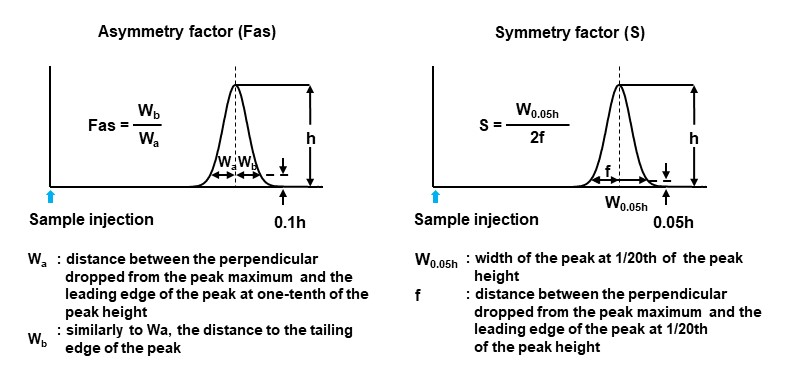
Asymmetry factor (Fas) and symmetry factor (S)
Asymmetry and symmetry factors are both indicators of peak symmetry. Figure 11 shows their calculation methods. Shodex uses asymmetric factor. With both factors, Fas or S = 1 indicates a symmetrical peak, Fas or S > 1.0 indicates tailing, and Fas or S < 1.0 indicates leading.
The certificate of analysis (COA) of a column includes values such as number of theoretical plates and asymmetry coefficient, as well as column pressure. It is convenient to check your column’s condition by comparing your analysis result with the values stated in a COA. However, the number of theoretical plates and the asymmetry coefficient vary greatly depending on the sample conditions and analysis conditions. If you’d like to compare the column performance with the initial column performance at the time of shipment, please make sure to use the same sample and analysis conditions mentioned on the COA.
7-3. Peak separation parameters
Peak separation parameters include retention factor, separation factor, and degree of resolution.
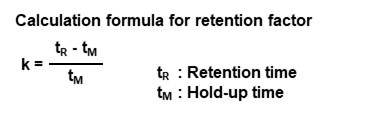
Retention factor (k)
Retention coefficient is an index of an analyte’s retention strength. It can be calculated by the retention time of the analyte minus the hold-up time, divided by the hold-up time. It is the ratio of the residence time of each analyte in the stationary phase to the residence time in the mobile phase.
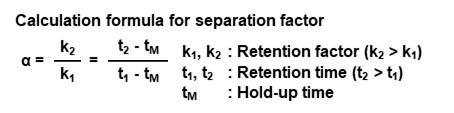
Separation factor (α)
The separation factor is an index of differences in selectivity between two adjacent peaks. It is calculated by dividing the retention coefficient (k2) of a peak that eluted later by the retention coefficient (k1) of a peak that eluted earlier. Normally, the separation factor is always greater than 1.
Resolution (Rs)
The resolution factor is an index of separation between two adjacent peaks. It is calculated using the below formula (1); by applying elution times and half-widths of each peak. A resolution of 1.5 or higher means that the peaks are completely separated (baseline separation). When two peak widths are equal, the resolution can be expressed using the below formula (2).
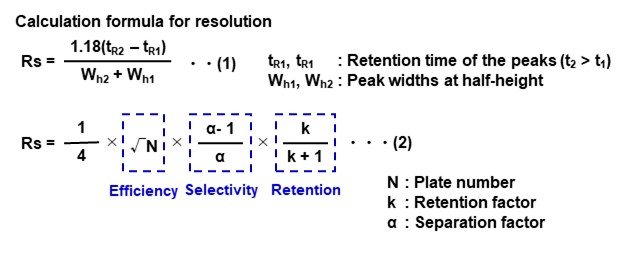
You can see that resolution is directly related to plate number (column efficiency), separation factor (selectivity), and retention factor (retention). If any of these parameters are extremely bad, achievement of baseline separation becomes difficult as shown in Figure 12. In order to achieve good separation of peaks, it is necessary to improve each parameter in a well-balanced manner. For this purpose, it is important to select a suitable column and optimize its analytical conditions (especially eluent).
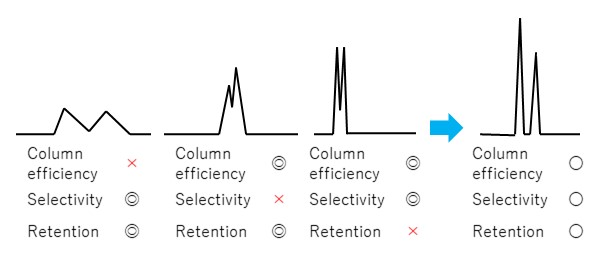
◎: Very good 〇: Good ×: Not good
8. HPLC Columns
A column consists of a chromatography tube and a packing material. Explanations of them follows below.
8-1. Chromatography tubes
As mentioned earlier, high pressure is applied to HPLC systems. Furthermore, HPLC eluents include acidic and alkaline solvents and various organic solvents. Material for chromatography tubes must have resistance towards pressure, corrosion, and solvents. As stainless steel (SUS) has these characteristics, it is the most often used material. Meanwhile, although polyetheretherketone (PEEK) has lower pressure and solvent resistances than that of SUS, it is used for the analysis of samples where metal contact should be avoided.
8-2. Packing materials
A packing material consists of a "base material" that serves as a skeleton and a "functional group" that is bonded/modified to the base material. Some packing materials are used as it is, without attaching any functional groups. There are two main base materials: silica base and polymer base.
Silica base material
Silica base material has been widely used as a packing material since the early days of HPLC. In addition to using the silica gel alone, silica base materials include those modified (attached to the silica gel) with various functional groups. Many people may be familiar with the name ODS column, which is a general term for silica base columns made by modifying octadecyl (C18 functional group having 18 carbons). While silica-based materials generally have excellent separation ability and strong mechanical strength, they have pH limitations such as low stability under acidic conditions and dissociate easily under alkaline conditions.
Polymer base material
There are various types of polymer base materials. The commonly used ones include styrene divinylbenzene copolymer, polymethacrylate, and polyvinyl alcohol. Similar to silica gel, some polymer base materials are used as they are, while others are modified with various functional groups. Polymer base columns can be used over a wide pH range, and they have high chemical stabilities. Shodex is advanced in its know-how synthesizing polymers and have been developing various polymer base HPLC columns.
As mentioned, silica base and polymer base account for the majority of the HPLC packing materials. Other minor base materials include natural products such as cellulose, agarose, dextrin, chitosan, and ceramics such as hydroxyapatite and zirconia.
8-3. Shapes of packing materials
In the past, HPLC packing material used was limited to microparticles, but in recent years, the use of monoliths has also increased. Here we will explain the differences between microparticles and monoliths.
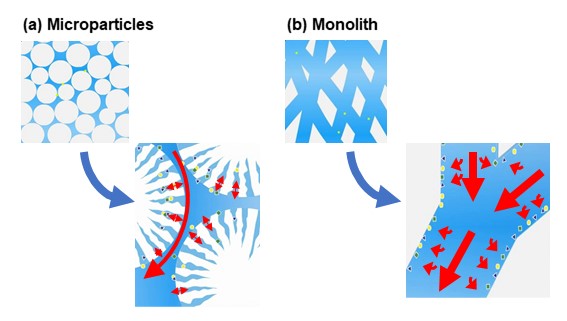
Microparticles
Microparticles are fine spherical particles with a particle size of several to several tens of micrometers. As shown in figure 13 (a), there are generally many pores on the particle surface. The size of pores (pore size) varies depending on packing material but is approximately several to several tens of nanometers. The eluent and analytes interact with surface of particles, but they also enter pores. Thus, presence of pores increases the contact area of the packing material. On the other hand, pores also affect the strength of the packing material and the diffusion of analytes, so particles without pores may be preferably used in some applications. The presence of pores is called porous, and the absence of pores is called nonporous.
Monolith
A monolith shapes like a single rod and has a continuous skeletal structure. As shown in figure 13 (b), a monolith is an integrated carrier, eluent and analytes pass through the solid interior and interactions occur on the surface of these tunnel-like pores. Compared to microparticle columns, monolith columns have a higher porosity, so they have lower pressure and can deliver liquid at higher flow rates.
From now on, we will focus on explaining the basics of microparticles.
8-4. Functional group
The word “interaction” has been mentioned several times in this course. In HPLC, different separation actions are created by using various interactions, called "separation modes."
The functional groups used differ depending on the required separation mode. There may be more than one functional group used to create one separation mode. It is not rare that by using a different functional group leads to a change in separation mode performance. There are a numerous variety of HPLC packing materials when considering the combinations of functional group and the base material.
8-5. Guard column and guard filter
Columns used for analysis are called analytical columns or main columns. Some products are equipped with guard columns or guard filters. Often, analytes are not the only species present in a sample. Presence of impurities can interfere with analysis. Also, insoluble impurities may cause column clogging while dissolved impurities may cause deterioration of columns. For this reason, in cases of samples containing impurities, it is common to perform various pretreatments on the sample. This includes liquid-liquid extraction or solid-phase extraction, or to remove insoluble components by filtering with a membrane filter before analysis. Even if you perform pretreatments, it may not be possible to remove impurities completely.
Guard columns are particularly effective against impurities that adsorb to the column. A guard column is a smaller (shorter) column than the main column and filled with the same packing material as the main column. It is connected at upstream of the main column (between the injector and the main column). Since the sample first passes through the guard column, adsorbable impurities are adsorbed by the guard column and therefore prevent them from entering the main column. By cleaning or replacing the guard column before entire guard column becomes contaminated prevents (reduce) the contamination of main column. Meanwhile, guard filters are effective against insoluble impurities in samples. By trapping insoluble components using a guard filter, it reduces their entry into the main column. Guard columns and guard filters are generally cheaper than the main columns. By using a guard column or a guard filter wisely, you can extend the main column life and consequently it can be more economic.